2014: JWST Delays
- "2014", this comic's number, redirects here. For the comic named "2014", see 1311: 2014.
|
| JWST Delays |
 Title text: Since delays should get less likely closer to the launch, most astronomers in 2018 believed the expansion of the schedule was slowing, but by early 2020 new measurements indicated that it was actually accelerating. |
Explanation
The James Webb Space Telescope (JWST) is a space telescope created to be the successor of the Hubble Space Telescope.
The telescope has been in development since 1996, but has been plagued by numerous delays and cost overruns. This comic was likely inspired by the most recent delay announcement, which was posted on June 27, 2018. At that time, the JWST was scheduled to launch on March 30, 2021. In July 2020, this was pushed back further to October 31, 2021 due to the coronavirus pandemic.
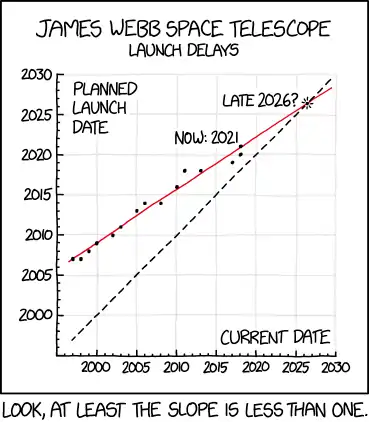
This comic portrays the launch delays and the new predicted launch years and the times at which those predictions were made. There have been so many delays in this project that you can plot a line of best fit with a surprisingly high degree of accuracy. Randall says optimistically that the line’s slope is less than one (there is less than one year of new delay per year of elapsed time), implying, of course, that if events continue without further intervention, it will eventually be built, with a predicted date of late 2026.
The title text compares the famous research over the universe’s accelerating expansion to the apparently ever-delaying schedule and observes that the delay per time does not decrease, although the date gets nearer (which should help to schedule the launch date, as research and unknown parameters are replaced with engineering and exact predictions and measurements). However, this delay inflation contradicts Randall's usage of a linear trendline.
The Wikipedia article linked above includes a table which provides the data points for the chart:
| Year | Planned launch | Time left (years) |
|---|---|---|
| 1997 | 2007 | 10 |
| 1998 | 2007 | 9 |
| 1999 | 2007 to 2008 | 8-9 |
| 2000 | 2009 | 9 |
| 2002 | 2010 | 8 |
| 2003 | 2011 | 8 |
| 2005 | 2013 | 8 |
| 2006 | 2014 | 8 |
| 2008 | 2014 | 6 |
| 2010 | 2015 to 2016 | 5-6 |
| 2011 | 2018 | 7 |
| 2013 | 2018 | 5 |
| 2017 | 2019 | 2 |
| 2018 | 2020 | 2 |
| 2018 | 2021 | 3 |
| 2020 | 2021 | 1 |
Transcript
- [Top caption, in the panel:]
- James Webb Space Telescope
- [Subtitle of top caption:]
- Launch Delays
- [There is a positive-quadrant only line graph. The x- axis is labeled 'Current Date' and the y axis is labeled 'Planned Launch Date'. The dates on both of the axes range from 1995 to 2030.]
- [In the graph are 15 points, starting at (1997,2007) and extending at a slope of a little less than one. The most recent one is labeled 'Now: 2021'.]
- [There are two lines on the graph: a red one and a dashed black one. The red one is a regression of the points on the graph. The black one is a line with a slope of one. They intersect at the point (2026,2026), marked by the label 'Late 2026'?]
- [Caption below the panel:]
- Look, at least the slope is less than one.
![]()
![]()
![]()
Discussion
Haha - I made this same graph 2 weeks ago! Cosmogoblin (talk) 17:39, 2 July 2018 (UTC)
Suggest the last sentence be made more general: "The title text refers to a fundamental question of the Big Bang Theory; will the universe expand forever, or will is collapse back on itself? The likely answer to this question has changed over the decades as new measurements have been made, and new theories such as dark matter and dark energy developed to explain the new measurements. Apparently, and for an analogous reason, between 2018 and 2020 the likely answer to the fundamental JWST question will change." GODZILLA (talk) 17:58, 2 July 2018 (UTC)
- I agree to the current sentence saying "and compares the universe’s accelerating expansion to the apparently ever-delaying schedule" but were the hell comes the conclusion that "the JWST will have enough delays to fill a universe"? This does not make any sense. Elektrizikekswerk (talk) 07:59, 3 July 2018 (UTC)
Does today's prediction of 2026 count? If that is included in the data set, it would then skew the best-fit line to be steeper. If a new prediction is made using that new best-fit line, that would further skew the line, and so on, causing the acceleration the title text anticipates between 2018 and 2020.162.158.63.88 20:10, 2 July 2018 (UTC)
> Until the slope of the line becomes more than one and the prediction goes to the past, right? 108.162.216.16 21:55, 2 July 2018 (UTC)
- No, it doesn't count, because it's just prediction, while the data set is of (official) planned launch dates. -- Hkmaly (talk) 22:06, 2 July 2018 (UTC)
- The Wikipedia data (taking the midpoint for ranges) fits a linear function with slope 0.660618 and intercept 687.739. This implies convergence at 2026.45, which is why Randall is predicting late 2026 for the actual launch. 172.69.22.56 15:04, 10 July 2018 (UTC)
Von Foersters's doomsday is Friday 13th of November 2026. (cue Twilight Zone intro) 162.158.89.175 21:20, 2 July 2018 (UTC)
Why does he keep saying it's 2021? Is he trying to skip Trump's term or what? --172.68.211.10 00:30, 3 July 2018 (UTC) Why do you think that Trump will get only 1 term?141.101.76.70 17:10, 3 July 2018 (UTC)
This is the same chart for the new airport in Berlin. Sadly its slope is not less than one, it is indeed accelerating...
2006 2011
2010 2012
2012 2013
2013 2014
2014 2016
2015 2018
2016 2018
2017 2022
Fabian42 (talk) 07:57, 3 July 2018 (UTC)
- says that the planned launch date from December 2017 is in October 2020 (not 2022). That would make the slope slightly less than 1 (unless you ignore the 2016->2011 data point, as outlier) --162.158.91.35 09:27, 4 July 2018 (UTC)
- There was a 2022 prediction earlier in 2017, I took the maximum value for each year. And honestly, 2202 sounds more reasonable than 2020 for me. Fabian42 (talk) 14:39, 4 July 2018 (UTC)
I feel a quadratic regression would be needed to determine acceleration / deceleration 172.68.59.24 13:54, 3 July 2018 (UTC)
- If you plot out the least-squares fit as it changes over time (i.e. repeat Randall's graph as each new data point was added), it fits a quadratic quite well. And converges to a 2025 date.
I wonder what this chart would look like for new york's 2nd avenue subway. 162.158.75.130 17:36, 3 July 2018 (UTC)
At least there _is_ a slope. How about Trump's wall? 173.245.52.151 00:52, 4 July 2018 (UTC)
Two more lines are coming together... the year and the XKCD index. 2018 should happen next week. IonFreeman (talk) 14:22, 5 July 2018 (UTC)
The last three data points have a slope greater than one. Just sayin'. Redbelly98 (talk) 19:55, 29 July 2018 (UTC)
- "NASA announced that the launch date has once again been delayed to 31 October 2021." THE RIDE NEVER ENDS 108.162.215.188 05:24, 17 September 2020 (UTC)
Did anyone else read the title text and immediately think of Covid-19? Did xkcd predict Covid? DID RANDALL CAUSE THE OUTBREAK?