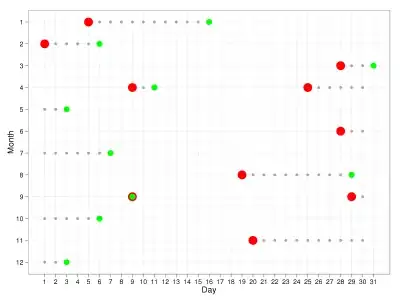
I have been trying to extend my own answer on drawing Gantt Charts to a more general case. I illustrate a partial result here:

A number of trips are plotted on this chart, with the red points representing departures, and the green dots a return. Now here is my challenge:
- I would like to mark all the days between a departure and a return with a grey point, and leave all others untouched.
- I would like the points to correctly wrap around the different month lengths (e.g. the departure 28 June would mark the days to 30 June and then wrap around to 1 July).
- The script should not fail in the case of a one-day trip (e.g. the trip in early Sep where departure and return happen on the same day and a smaller green dot is plotted on a larger red marker).
It is trivial to produce this graph with the code below, and it would be easy to join the dots with a line from red to green where both happen in the same month. Can anyone help with the case of a wrap around in a manner general enough to take on also leap and non-leap years etc?
library("ggplot2")

# ----------------
# LOAD DATA

df <- read.table(text='id,dep_month,dep_day,ret_month,ret_day
c,1,5,1,16
v,2,1,2,6
a,3,28,3,31
z,4,9,4,11
y,4,25,5,3
f,6,28,7,7
w,8,19,8,29
b,9,9,9,9
k,9,29,10,6
n,11,20,12,3', header = TRUE,
                 sep = ',')

# ----------------
# DRAW YEAR CHART

p <- ggplot(data = df,
            aes(x = dep_day,
                y = dep_month
                )
            )
p <- p + theme_bw()
p <- p + geom_point(colour = 'red',
                    size = 6)
p <- p + geom_point(aes(x = ret_day,
                       y = ret_month
                       ),
                   colour = 'green',
                   size = 4
                    )
p <- p + scale_x_continuous( breaks = c(1:31) )
p <- p + scale_y_reverse( breaks = c(1:12) )
p <- p + ylab("Month") + xlab("Day")
print(p)