17

Update: Microsoft have now reproduced the bug and are working on a fix.

Whilst evaluating the viability of the .NET platform for low latency software development, we have discovered a serious bug in the .NET 4 concurrent workstation garbage collector that can cause applications to hang for up to several minutes at a time.

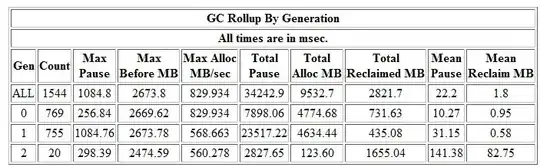
On three of our machines the following simple C# program causes the GC to leak memory until none remains and a single mammoth GC cycle kicks in, stalling the program for several minutes (!) while 11Gb of heap is recycled:

    static void Main(string[] args)
    {
        var q = new System.Collections.Generic.Queue<System.Object>();
        while (true)
        {
            q.Enqueue(0);
            if (q.Count > 1000000)
                q.Dequeue();
        }
    }

You need to compile for x64 on a 64-bit Windows OS with .NET 4 and run with the default (concurrent workstation) GC using the default (interactive) latency setting.

Here's what the Task Manager looks like when running this program on this machine:

alt text

Note that 11Gb of heap have been leaked here when this program requires no more than 100Mb of memory.

We have now accumulated around a dozen repros of this bug, written in F# as well as C#, and it appears to be related to a bug in the GC write barrier when most of gen0 survives. However, Microsoft have not yet been able to reproduce it. Can you? If so, can you please describe your setup as accurately as possible so we can try to narrow down exactly what conditions are required for this bug to manifest.

J D
  • 48,105
  • 13
  • 171
  • 274
  • What happens when you use serverGC? – leppie Oct 19 '10 at 10:00
  • What do the .NET memory performance counters show? – Richard Oct 19 '10 at 10:24
  • @leppie: Using other GC options or other GCs (including server) avoids the bug. However, the concurrent workstation GC is the only low latency option for steady state that Microsoft offer and we want low latency. The server GC has much worse latency in general, of course. Microsoft are coy about their GC algorithms but I believe the server GC is naive stop-the-world with parallel traversal. – J D Oct 19 '10 at 11:14
  • @Jon Harrop: I did not find it so disastrous. What I did see, is a lot less GC's, about 10% based on count. It did not however affect performance. (based on tests for IronScheme but also just on .NET 3.5). – leppie Oct 19 '10 at 12:23
  • Did you already file a bug report at MS? If yes, it would be nice if you could link against it in your question. – Bobby Oct 21 '10 at 14:31
  • @Bobby: I don't know how to do that but I have told three MS employees and they have said they are looking into it. I assume they would file the bug themselves. – J D Oct 21 '10 at 15:51
  • @Richard: The .NET memory performance counters show that gen2 is consuming all of the memory. – J D Oct 21 '10 at 16:04
  • @Jon Harrop: You can use [Microsoft Connect](http://connect.microsoft.com/VisualStudio) to file a bug report. – Bobby Oct 21 '10 at 16:36
  • 1
    Congrats on finally getting this filed as a proper bug. – alex Oct 22 '10 at 12:23
  • Can you please link to the Microsoft bug report? Has it been solved? – Mary Ellen Bench Mar 30 '16 at 21:01
  • 1
    @MaryEllenBench: The bug is fixed. I have no idea where the bug report is. I just wrote to Maoni Stephens at Microsoft and she fixed it immediately. – J D Mar 30 '16 at 22:05
  • What version of .net was it fixed in? – Mary Ellen Bench Apr 01 '16 at 19:25

2 Answers2

3

I couldn't reproduce it. I tried it on a x64 with 4 gigs ram& compiled as ANY. The maximum memory usage was at around 2.5 gigs. The max GC pause time was around 1084 ms.

Here is the output from my GC ETW stats. alt text

You could also get GC Events by time alt text

Probably a similar trace output from your run could help in understanding what is happening under the covers.

In .NET 4.0 there is Event tracing for Windows (ETW) that provides Framework tracing information. Here is the one specific to GC.

And to get this information there is a tool which is called PerfView

Here are the steps in using the tool to get the GC Information

  1. Start a cmd.exe as an admin , this required to collect ETW tracing
  2. Start the application that you want to trace
  3. Issue the command “PerfMonitor.exe /process:4180 start” where 4180 is the process id
  4. Let the app run for a while
  5. Then issue “PerfMonitor.exe stop”
  6. The command to get the report “PerfMonitor.exe GCTime”. This will generate a report and open it in the browser with GC stats.
Glorfindel
  • 21,988
  • 13
  • 81
  • 109
Naveen
  • 4,092
  • 29
  • 31
  • 1
    Thanks for the reference to `PerfMonitor`. According to that tool, the longest pause time is only 618ms here but closer inspection shows regular 18ms pauses every 60-130ms except for a massive 145s gap immediately prior to that longest 618ms GC pause. So my time was not lost to what `PerfMonitor` considers to be GC pause. – J D Oct 22 '10 at 10:40
  • Maoni Stephens of Microsoft and author of this garbage collector says "It is a GC pause. PerfMonitor doesn’t intrepret enough info to recognize it.". – J D Oct 22 '10 at 12:17
2

Running the code in linqpad indeed causes huge memory consumption if running as 64-bit; running as 32-bit works fine.

I've got a windows 7 x64 ultimate install (patched as usual) with 8GB of main memory; VS.NET and other dev tools are installed so there might be some weird debugger hooks which aren't present on an otherwise blank machine.

Odd that they haven't repro'd it. Are you sure there's not some communication breakdown there?

Oh, and using "new object()" rather than a boxed value type causes the same issue (unsurprisingly), so you might want to remove the confounding factor of boxing from your repro case.

Eamon Nerbonne
  • 47,023
  • 20
  • 101
  • 166
  • Thanks! "Are you sure there's not some communication breakdown there?" Perhaps. I've given the repro as a C# solution to someone else at MS to test. "you might want to remove the confounding factor." Good idea, will do. – J D Oct 19 '10 at 12:22