0

Its been a while that I'm stuck with an apparently "simple" problem. My goal is to build the envelope of a set of lines that are "attached" to a curve. Let's say a curve like this:

enter image description here

For the above example I would expect the envelope of lines (whose directions are depicted by arrows and are orthogonal to the edges of the red curve) to be an arc of a circle. I thought of doing this in two computationally separate ways:

  1. Intersection of consecutive lines: In an ideal smooth world, the envelop of lines attached is a curve where the red lines are all tangent to. Now, coming back to the discrete world I try to obtain the envelope curve by intersecting consecutive lines (for example the first line with the second line would give the first vertex of the envelope).
  2. Evolute of the red curve: Again in an ideal smooth world, one can think of such an envelop as the evolute of the red curve (see Evolute - wikipedia). Therefore, all I had to do in addition to current info was to compute the curvature and then build the evolute (naturally I had to use a discrete version of curvature which you can find its definition here: Discrete Curvature - wikipedia).

Doing any of the above approaches I would get the following result: enter image description here
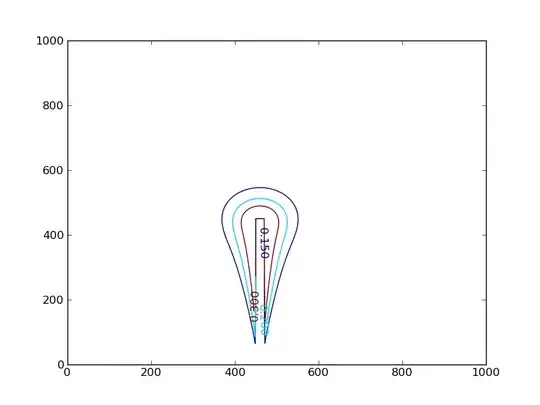
However, finding the "correct arc" is heavily dependent on the accuracy of the initial data which is the red curve. As soon as the red curve has some "noises" in the vertices the envelope is heavily distorted. Here I add a picture (where the red curve is visually intact (but not actually) yet the envelope is distorted):

Both of my approaches (intersection of lines and evolute) fail when the red curve is noisy.

My Question: How can I rectify this? I believe there should be a numerical approach to solve this issue as I badly need this envelope to be correctly built. I'm a mathematician and am not fully aware of the numerical tricks that might exist in dealing with cases like this. However, I believe that this should be a standard question in computer graphics community though I could not find anything properly relevant after searching for months.

It would be great if the solutions are in MATLAB language. Please let me know if you want me to be more accurate regarding the passage.
  • see [draw outline for some connected lines](https://stackoverflow.com/a/22068534/2521214) – Spektre Oct 21 '22 at 06:35
  • Are you asking for an offset curve from the original, where every point is set distance away? – John Alexiou Oct 24 '22 at 22:59
  • At this point in time I am not sure what might be best without seeing the data. So as a start if you can provide the data you are using to calculate the lines and the code you are using calculate the intersection points for, perhaps, 40 lines. – petern0691 Oct 25 '22 at 00:10
  • My comment above was meant to be a follow up comment to my request below. – petern0691 Oct 25 '22 at 00:50
  • Do you have a description of the slope of the curve, or how its changing or is it just points? Either way, you can fit a cubic spline and get the slope information, which means you can get the normal direction and thus calculate the offset curve points. – John Alexiou Oct 25 '22 at 14:32

1 Answers1

0

For the line intersecton method, yes, because the lines are relatively parallel, any small error in the defining data for a line will produce a dramatic error in their intersection points.

I suggest the following:

  1. Calculate all lines.
  2. Calculate all intersection points of the adjacent lines.
  3. Calculate the distances between all adjacent intersection points.
  4. Sequence plot the distances, and identify all distances which are more than, perhaps, 2 standard deviations from the trend line of the distances.
  5. If the data is not "too bad" then I think the identified distances will mostly come in pairs, ie, there is one "bad" intersection line causing two "bad" distances.
  6. Exclude the "bad" lines and reprocess the remaining intersection points.

The above assumes the granularity of the data is greater where the base curve is curvier.

If the intersection point distances seem to form two trend lines, especially if they look like to two diverging, or two converging, trend lines, then group the intersection lines accordingly, plot two envelopes, and take the average of the two envelopes as "the envelope". (Or perahps even more trend lines, if there is a regular error in the data.)

But, if there are signs of regular data errors, then a contextual assessment and analysis of the data source and how it was generated/gathered/measured might be required to correctly determine which data should be excluded.

petern0691
  • 868
  • 4
  • 11