25

When plotting only the legend (of a raster object - a colorbar):

require(raster)
r = raster()
r[] = 1
plot(r, legend=F)
plot(r, zlim=c(-10,10), legend.only=T)

how can I control the legend axis label size, tick length, and other legend properties? I know I can call par(...) before the last plot() call, but is there a cleaner way?

Josh O'Brien
  • 159,210
  • 26
  • 366
  • 455
Benjamin
  • 11,560
  • 13
  • 70
  • 119

2 Answers2

52

You can pass axis.args and legend.args as arguments to the legend only function call, as for image.plot in the fields package.

For example, to specify tick positions and labels, and to reduce tick label size, the following should do the trick. It will also accept arguments such as legend.width and legend.shrink.

require(raster)
data(volcano)
r <- raster(volcano)
plot(r, col=topo.colors(100), legend=FALSE, axes=FALSE)
r.range <- c(minValue(r), maxValue(r))
plot(r, legend.only=TRUE, col=topo.colors(100),
     legend.width=1, legend.shrink=0.75,
     axis.args=list(at=seq(r.range[1], r.range[2], 25),
                    labels=seq(r.range[1], r.range[2], 25), 
                    cex.axis=0.6),
     legend.args=list(text='Elevation (m)', side=4, font=2, line=2.5, cex=0.8))

legend only - arguments

jbaums
  • 27,115
  • 5
  • 79
  • 119
6

It's also possible to work with the 'smallplot' argument in when 'legend.only=TRUE'. Small works from the bottom/left corner of the plot area smallplot=c(min % from left, max % from left, min % from bottom, max % from bottom).

# load data & plot
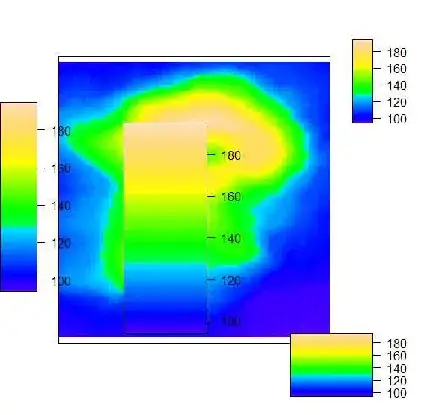
require(raster); data(volcano); r <- raster(volcano)
plot(r, col=topo.colors(100), legend=FALSE, axes=FALSE)
r.range <- c(minValue(r), maxValue(r))

plot(r, legend.only=TRUE, col=topo.colors(100), legend.width=1, legend.shrink=0.75,
    smallplot=c(0,.09, .3,.75)); par(mar = par("mar"))

plot(r, legend.only=TRUE, col=topo.colors(100), legend.width=1, legend.shrink=0.75,
    smallplot=c(0.3,0.5, 0.2,0.7)); par(mar = par("mar"))

plot(r, legend.only=TRUE, col=topo.colors(100), legend.width=1, legend.shrink=0.75,
    smallplot=c(0.85,0.9, 0.7,0.9)); par(mar = par("mar"))

plot(r, legend.only=TRUE, col=topo.colors(100), legend.width=1, legend.shrink=0.75,
    smallplot=c(0.7,0.90, 0.05,0.2)); par(mar = par("mar"))

enter image description here

Matthew Bayly
  • 556
  • 5
  • 7