1

I have this gnuplot script

reset
set palette model RGB defined (0 "gray", 0.1 "white", 0.33 "yellow", 0.66 "orange", 1 "red")
set xlabel "x"
set ylabel "y"
set view map
set border 0
unset xtics
unset ytics
splot file_name u 1:2:5:xtic(3):ytic(4) w points ps 5 pt 5 palette

And this is the result:

heatmap

How can I remove the distance between the points so that I end up with a set of adjacent squares? I want to plot a heatmap with a square for each point in my grid file.

EDIT

The correct way to plot a "grid" heatmap as per @andyras answer is:

set pm3d map
plot file_name u 1:2:5:xtic(3):ytic(4) with image

Which gives this image:

Grid heatmap

gnuplot offers a third way to plot a heatmap based on connecting points of a 3d surface, rather than grid cells. That is, the x,y coordinates at columns 1,2 are used as corners, or connecting points, of a surface mesh and the colors used in each region are the average of the RGB/HSV values for the 4 defining corners:

set pm3d map
splot file_name u 1:2:5:xtic(3):ytic(4)
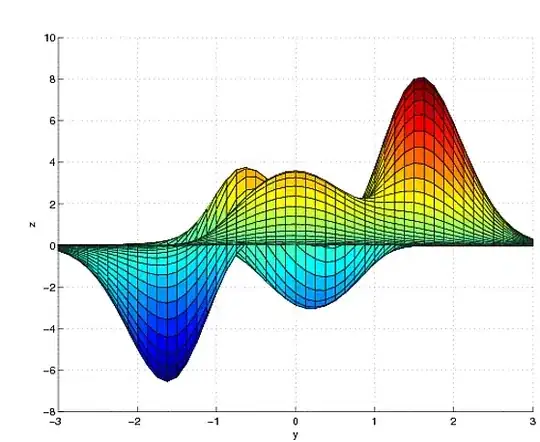
3d heatmaps with top view

Robert Kubrick
  • 8,413
  • 13
  • 59
  • 91
  • Just a slight addition to your discussion of pm3d -- You can change how gnuplot picks the color for a particular quadrilateral by `set pm3d corners2color ...` By default, gnuplot averages the 4 points as you said (`corners2color mean`) but you can have it pick any of the 4 corners (`c1`,`c2`,`c3` or `c4`) or you can have it do a geometric mean `geomean`, take the `min` or the `max`, etc. – mgilson Nov 08 '12 at 13:40
  • Also note that `pm3d` is able to handle arbitrary quadrilaterals whereas `image` can only handle rectangles (or possibly parallelograms -- the documentation says parallelipiped, but I think that's wrong). – mgilson Nov 08 '12 at 13:45

1 Answers1

1

I usually go with the options

set pm3d map
plot file_name u 1:2:5:xtic(3):ytic(4) with image

for gridded data (it makes a smaller file if you use vector formats). I suspect your problem may be to do with the fact that you specify a point style and size for your splot. So, you could try setting the pm3d map option and using splot without the point specification, or plot ... with image.

andyras
  • 15,542
  • 6
  • 55
  • 77